
Does money buy wins?
Spending and football results for the site's 68 schools, 2007–2024: what the money does and doesn't predict. Spending goes with winning, but it explains only about 11% of the variation in a season's win%, and big buyouts don't buy a lasting turnaround.
90%
of playoff spots (2014–2024) went to top-20 football spenders
$1.34B
in coaching buyouts at public schools, with no lasting win gain
3.8x
range in cost per win: $2.7M Cincinnati to $10.3M Rutgers (2015–24)
$7.02B
athletic debt, more than doubled from $2.94B (41 publics, FY2008–FY2025)
Methodology and caveats
- Regular-season win% only. The schedule dataset lacks postseason games for most years, so bowl and CFP wins are excluded. The 2020 COVID season had shortened schedules.
- Nominal dollars. Figures are not inflation-adjusted. The main tests use year-relative spending: each school's spend divided by that season's median across the 68 schools.
- Correlation isn't causation. Winning also raises revenue, which raises spending, so the arrow likely runs both ways.
- EADA cost-allocation leeway. Schools have discretion in how they assign expenses to football, so some low-spend figures (e.g. Cincinnati, Houston) may partly reflect accounting.
- Coverage. Knight-Newhouse metrics cover the 53 public schools only. Season Y is paired with fiscal year Y+1; n=1,224 school-seasons.
- Hand-entered lists. The 2014–2023 CFP fields and 2007–2023 BCS/CFP champions were entered from the public record (2024–25 come from the schedule data).
1. Spending and wins
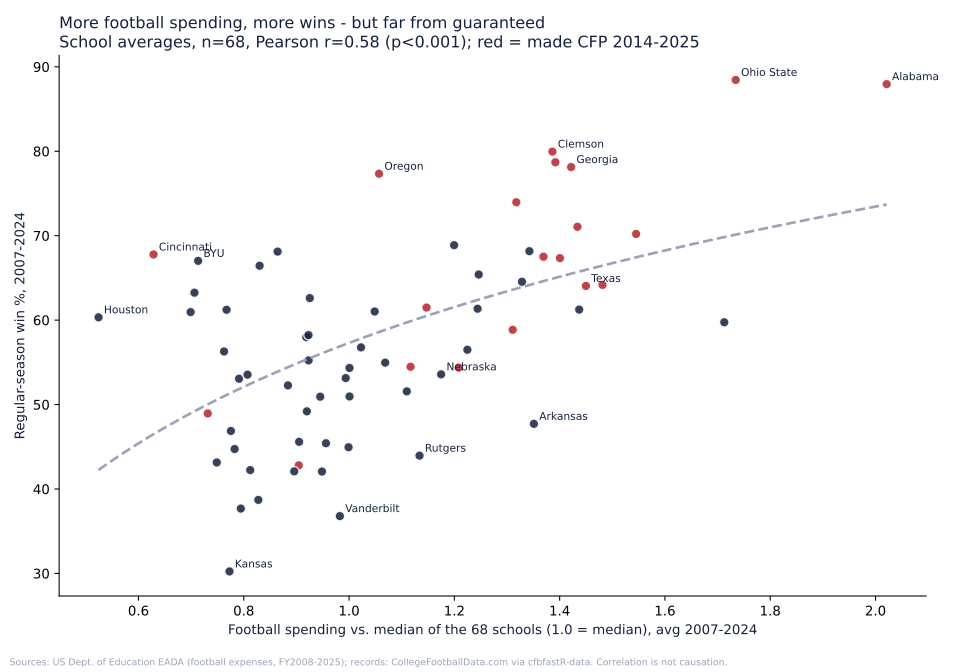
- Pooled 2007–24, relative football spend vs. win%: r=0.349 (Spearman ρ=0.339, n=1,224). Total athletic spend is weaker (r=0.259); nominal football spend r=0.205. [EADA] [cfbfastR-data]
- School averages, 2007–24 (n=68): r=0.584, ρ=0.503.
- Year by year, r ranges from 0.20 (2021, not significant) to 0.52 (2015); it was 0.416 in 2024.
- Regression: R²=0.111. Doubling relative spend goes with about +16 percentage points of win%. Spending explains roughly 11% of the variation in season win%.
2. When a school spends more, does it win more?
- Within schools (school and year averages removed): r=0.206.
- Weak/null: year-over-year spending growth vs. the next season's change in win%: r=-0.078. A budget bump does not predict a better next season.
- Long run, 2007–09 vs. 2022–24: change in relative spend vs. change in win%, r=0.363 (n=68).
3. Playoff teams vs. everyone else, 2014–2024
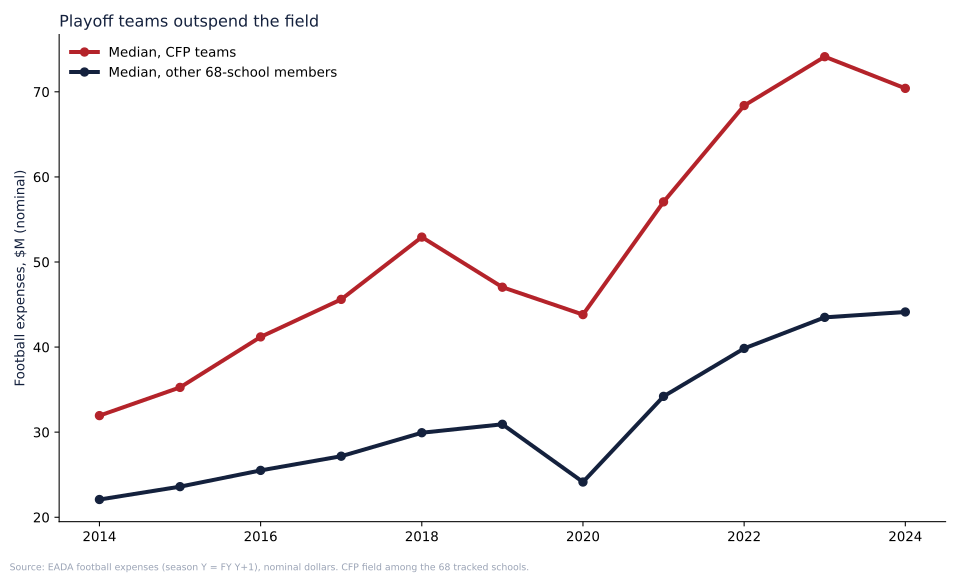
- 51 CFP berths among the 68 schools. Median relative spend: 1.64x for CFP teams vs. 0.98x for the rest; median football expenses $52.6M vs. $30.7M. [EADA]
- 66.7% of CFP berths went to a top-10 football spender that season, and 90.2% to a top-20 spender.
- Champions, 2007–2024 (public record): Alabama ranked #1 or #2 in football spending in all 6 of its title seasons; Auburn #1 in 2010; Ohio State #2 in 2024. The lowest-ranked champions were LSU (#19 in 2007, #15 in 2019).
4. Cost per regular-season win, 2015–2024
- EADA football expenses divided by regular-season wins. Median: $5.38M. [EADA] [cfbfastR-data]
- Cheapest: Cincinnati $2.70M, Houston $2.74M, Kansas State $2.94M, Oklahoma State $3.20M, BYU $3.29M.
- Priciest: Rutgers $10.33M, Arkansas $9.03M, Florida State $8.58M, Nebraska $8.24M, Vanderbilt $8.10M.
5. Over- and underperformers (wins above/below the spending model, per season, 2007–24)
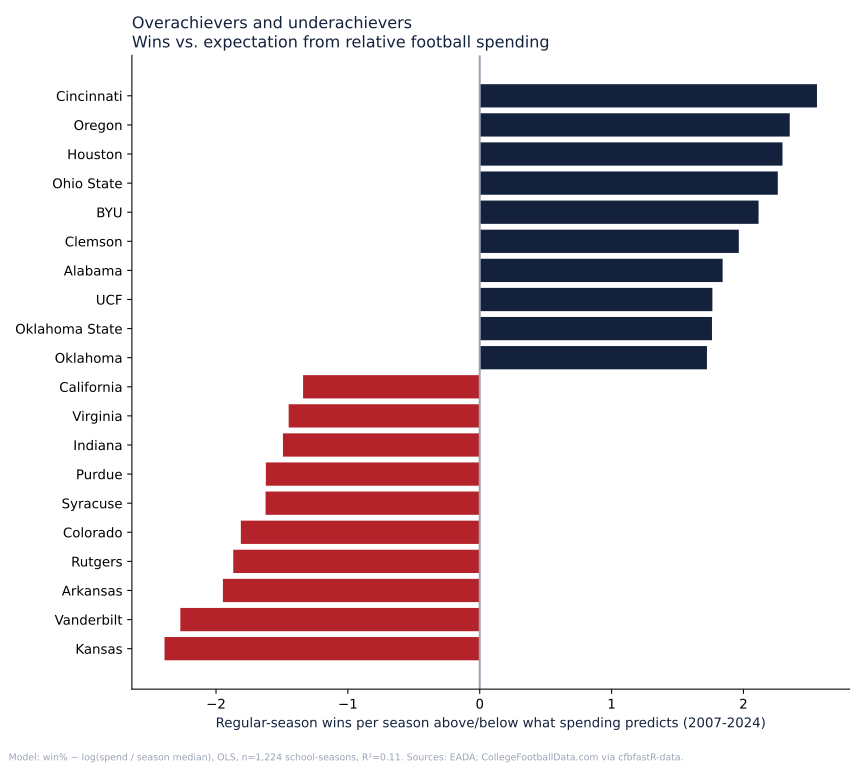
- Over: Cincinnati +2.56, Oregon +2.35, Houston +2.30, Ohio State +2.26, BYU +2.12, Clemson +1.97, Alabama +1.84, UCF +1.77.
- Under: Kansas −2.39, Vanderbilt −2.27, Arkansas −1.95, Rutgers −1.87, Colorado −1.81, Syracuse −1.62, Purdue −1.62, Indiana −1.49 (Indiana's 2025 season falls outside the window).
6. Subsidies (public schools)
- Weak/null: subsidy share vs. win%, pooled r=-0.094 (n=952); school averages r=−0.149 (not significant), ρ=−0.293. [Knight-Newhouse]
- Median subsidy share for CFP teams: 1.6% of revenue (n=46).
- The most-subsidized programs (Houston 57%, UCF 48%, Cincinnati 40%) are also strong overachievers, so subsidy is not simply a mark of failure.
7. Coach pay
- Football coaching salaries relative to the season median vs. win%: r=0.421 (n=951), the strongest single spending correlate. [Knight-Newhouse]
- Weak: coaches' share of football spend vs. win%, r=0.114.
8. Buyouts
- Across 49 school-years with at least $5M in coaching severance (FY2008–25), win% averaged 0.540 in the 2 seasons before, 0.449 in the buyout season and 0.540 in the next 2. No net gain (paired t p=0.99); only 42.9% improved on their pre-buyout level. [Knight-Newhouse]
- Total severance across the tracked publics: $1.34B. Leaders: Auburn $91.0M, Nebraska $60.3M, Texas A&M $59.8M, Texas $55.4M, Indiana $55.2M.
- Caveat: Knight-Newhouse severance covers all sports, and fiscal-year timing is approximate.
9. Spending vs. revenue growth, FY2008→FY2025
- EADA, all 68 schools: total expenses +199.6% ($3.88B→$11.62B), total revenue +185.4%, football expenses +245.8%, football revenue +183.6%. [EADA]
- Knight-Newhouse, 41 publics with both years: expenses +193.9% ($2.58B→$7.58B) vs. revenue net of transfers +174.8%. Subsidies +182.6% ($246M→$697M); athletics debt +138.8% ($2.94B→$7.02B). [Knight-Newhouse]
- In FY2025, 20 of 53 publics had expenses above revenue net of transfers.
- All figures are nominal; for scale, consumer prices rose very roughly 55–60% over the period (approximate, not used in calculations).
Sources
- EADA: U.S. Dept. of Education, Equity in Athletics Data Analysis (football and total athletic expenses/revenue, FY2008–FY2025, all 68 schools)
- Knight-Newhouse: Knight-Newhouse College Athletics Database (subsidy, coaching salaries, severance, debt; 53 public schools)
- cfbfastR-data: sportsdataverse cfbfastR-data schedule files, sourced from CollegeFootballData.com (regular-season results)
- CollegeFootballData: CollegeFootballData.com, the upstream source of the cfbfastR-data schedules
- 2014–2023 CFP fields and 2007–2023 BCS/CFP champions: entered from the public record.
- AP rankings were not used.
Related: Coach pay & buyouts · Deficits, subsidies & debt · Where the money flows